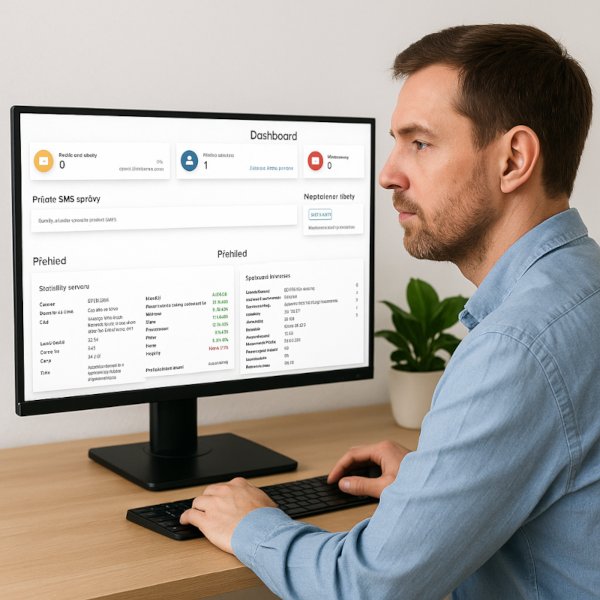
The ISPadmin Dashboard is your first stop after logging in – and the quickest way to get a clear picture in just a few seconds of what’s happening in your network and company today. By default, it opens the Overview tab and serves as your operational “control tower”: instead of hunting for information across various modules, you have the essentials right in front of you. A quick glance in the morning is usually enough to know whether the network is fine, how many devices are offline, what’s waiting for support, whether tickets are piling up, or where the first warnings appear that could grow into a problem.
The Dashboard is made up of widgets – overview blocks that display specific data. That’s exactly where its strength lies: every team and every person can have a different “home screen” based on their role. Technicians can prioritize offline routers, alerts, link utilization, or high CPU load at the top. Support staff can display new and unread tickets, internal messages, and tasks. Finance and management can view a monthly financial summary, billing statistics, or a service overview. Simply put – as soon as you log in, everyone sees exactly what speeds up their work and decision-making, without wasting time searching.
Customizing the Dashboard is quick and intuitive. In each tab, next to its title, you’ll find a settings menu where you can enable or disable widgets and, for selected ones, adjust what data they show. When your priorities change – for example, you’re dealing with a major incident or want to temporarily focus on overdue payments – you can adjust the Dashboard with just a few clicks. Besides the widgets themselves, you can also set the position of individual sections, so you can customize not only the content but also the order of tabs.
Security and teamwork are important aspects of this as well. The Dashboard automatically respects user permissions, so the list of available widgets and the displayed data are shown to each user only according to the parts of the system they have access to. This ensures that everyone sees only what they need to do their job.
Ultimately, the Dashboard is where every workday in ISPadmin begins, and when properly configured, it saves time across the entire company: support reacts faster, technicians have a real-time view of the network, finance sees cash-flow trends without extra reports, and management has key metrics at hand instantly.
If you want to get the most out of the Dashboard, start by configuring your user permissions. Then each team can build its own overview exactly as needed. And when priorities change, just a few clicks will adjust the Dashboard to whatever is important at the moment – making it your everyday compass for a stable network, smoother support, and a healthier business.
